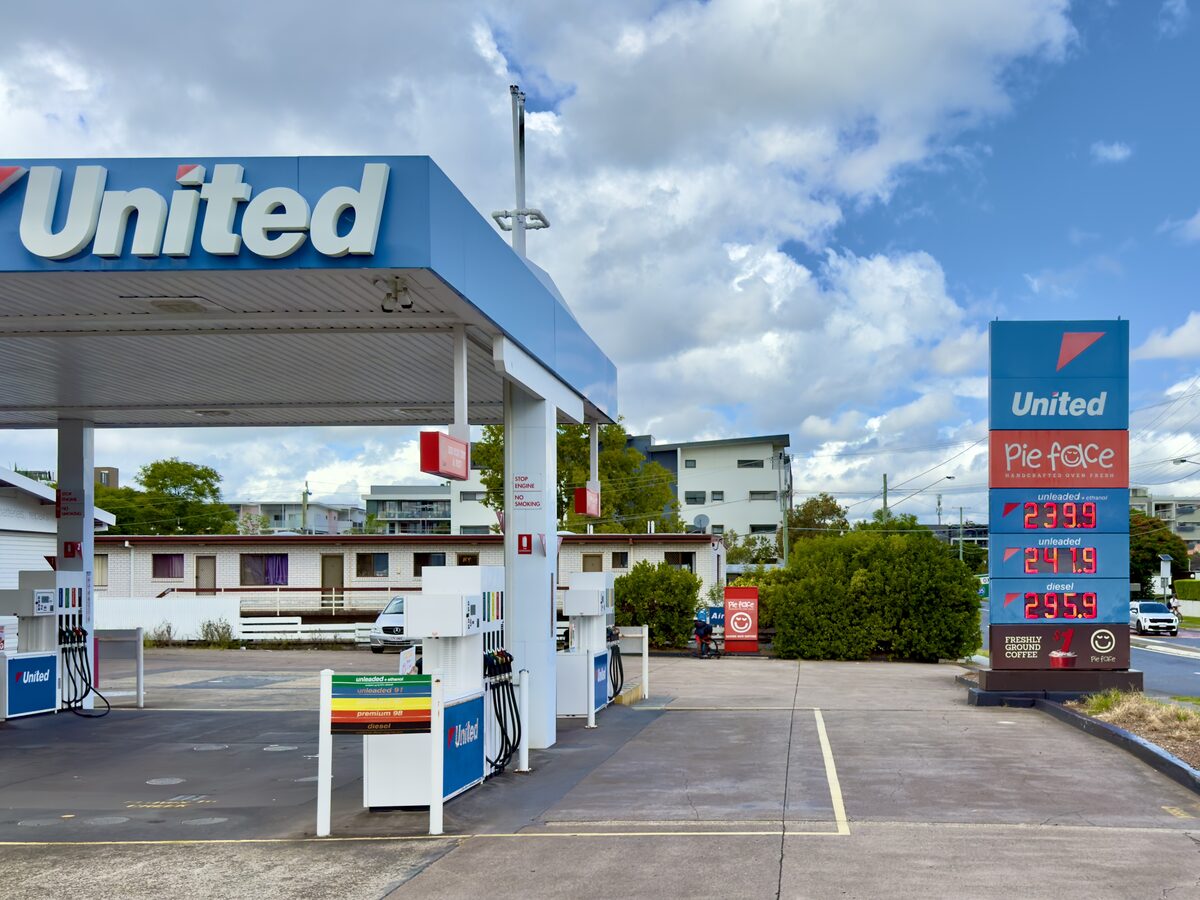
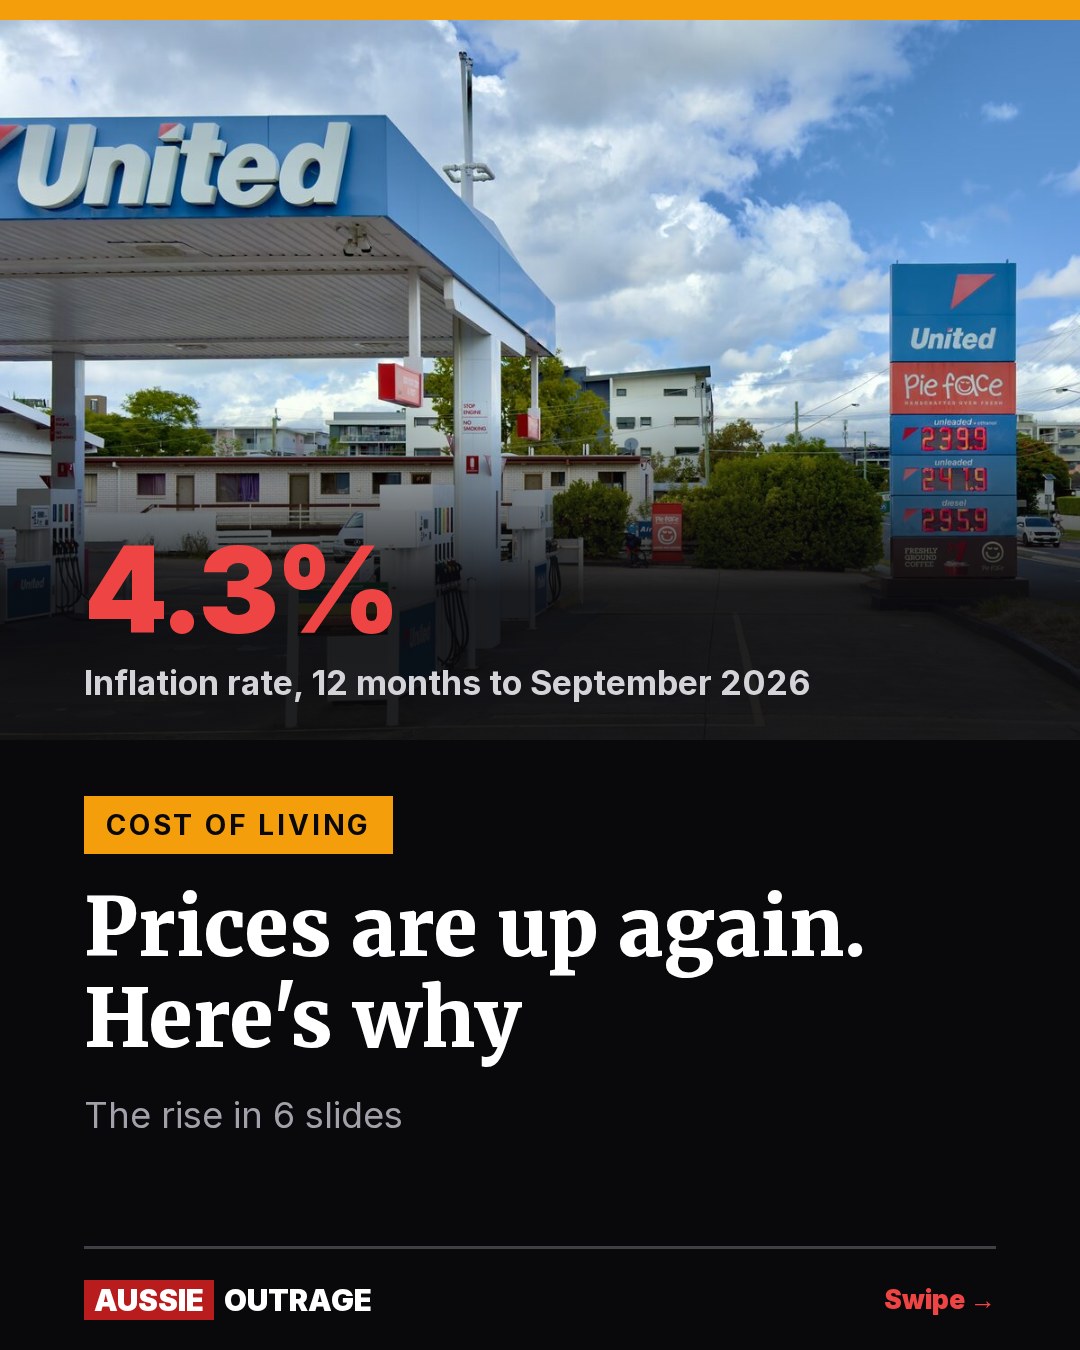
4.3%
Australia's inflation rate, 12 months to September 2026
Australia's inflation rate climbs to 4.3%. Here's why
Australia's inflation rate rose to 4.3% in September 2026, up from 4.0%. Petrol, up 23.6% in a year, and power bills after the rebates ended led the rise.
Aussie Outrage · · 13 min read
Updated 30 October 2026
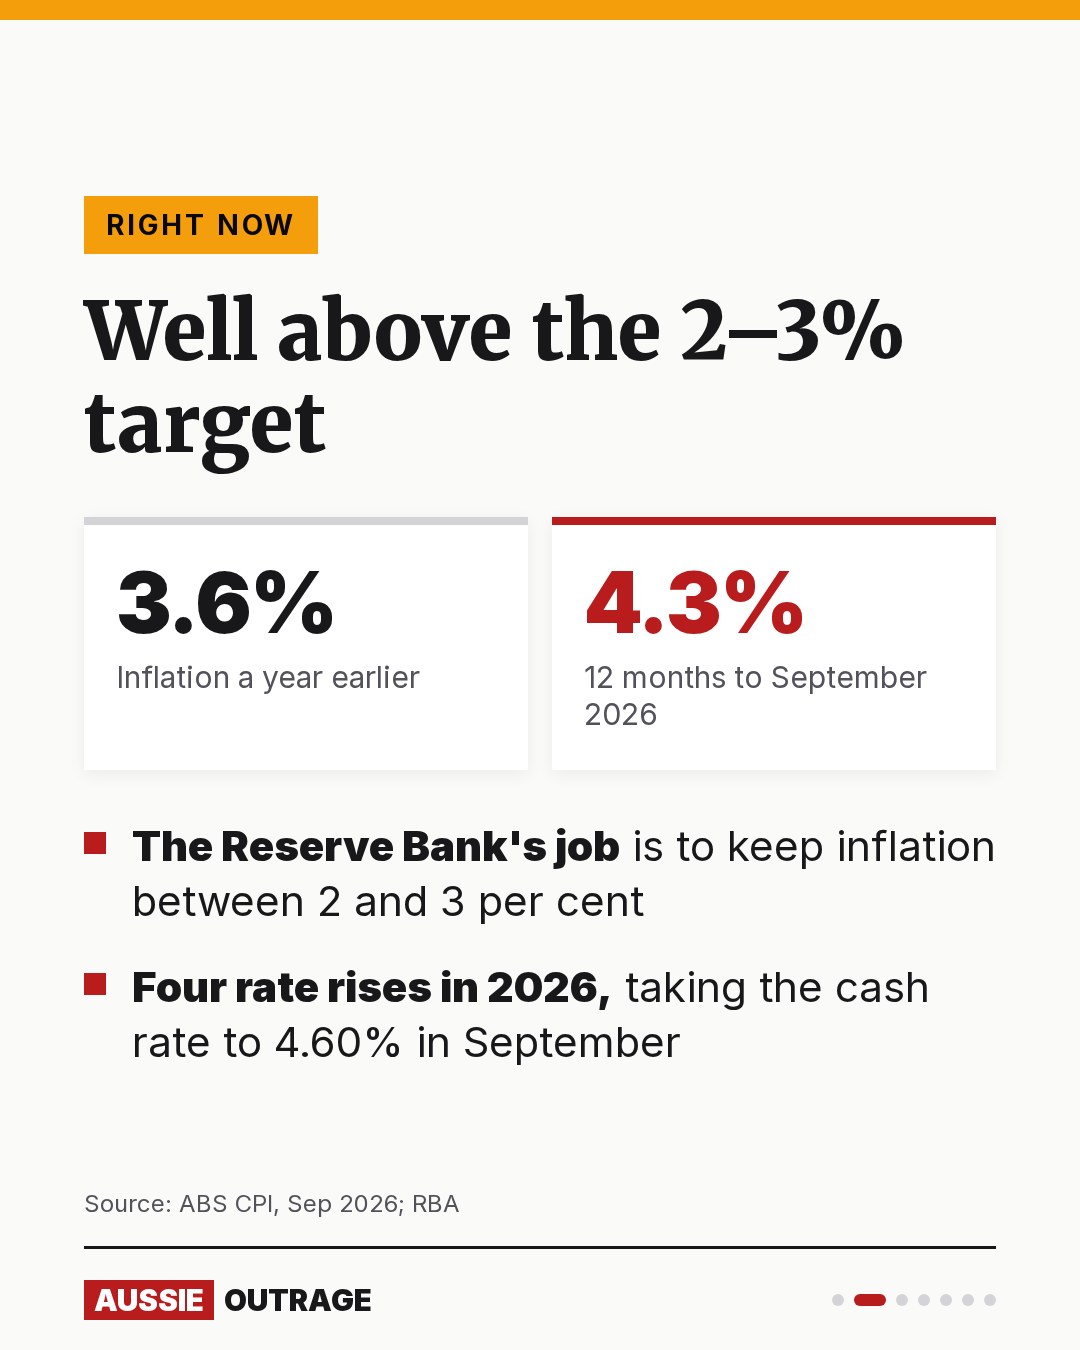
Australia's inflation rate is 4.3%. That's how much consumer prices rose in the 12 months to September 2026, according to the Australian Bureau of Statistics, up from 4.0% in the 12 months to August. A year earlier it was 3.6%, and in mid-2025 it had dropped close to 2%.
4.3%
The Reserve Bank's job is to keep inflation between 2 and 3 per cent. It's now well above that, and the Reserve Bank has raised interest rates four times this year to try to bring it down.
Why Australia's inflation is rising again
The ABS breaks the price rises down by category. Over the 12 months to September 2026, petrol and electricity were the biggest rises in household bills, and the ABS puts the electricity rise down to government relief coming to an end.
Petrol and power: the biggest rises
Price rise over the 12 months to September 2026
Petrol and diesel
23.6%Electricity
12.8%Council rates and charges
5.6%Insurance
5.4%New homes
4.7%All prices (inflation rate)
4.3%Meals out and takeaway
3.9%Rents
3.6%Food and non-alcoholic drinks
3.2%
Source: ABS Consumer Price Index, September 2026
Show the data
| Item | Value |
|---|---|
| Petrol and diesel | 23.6% |
| Electricity | 12.8% |
| Council rates and charges | 5.6% |
| Insurance | 5.4% |
| New homes | 4.7% |
| All prices (inflation rate) | 4.3% |
| Meals out and takeaway | 3.9% |
| Rents | 3.6% |
| Food and non-alcoholic drinks | 3.2% |
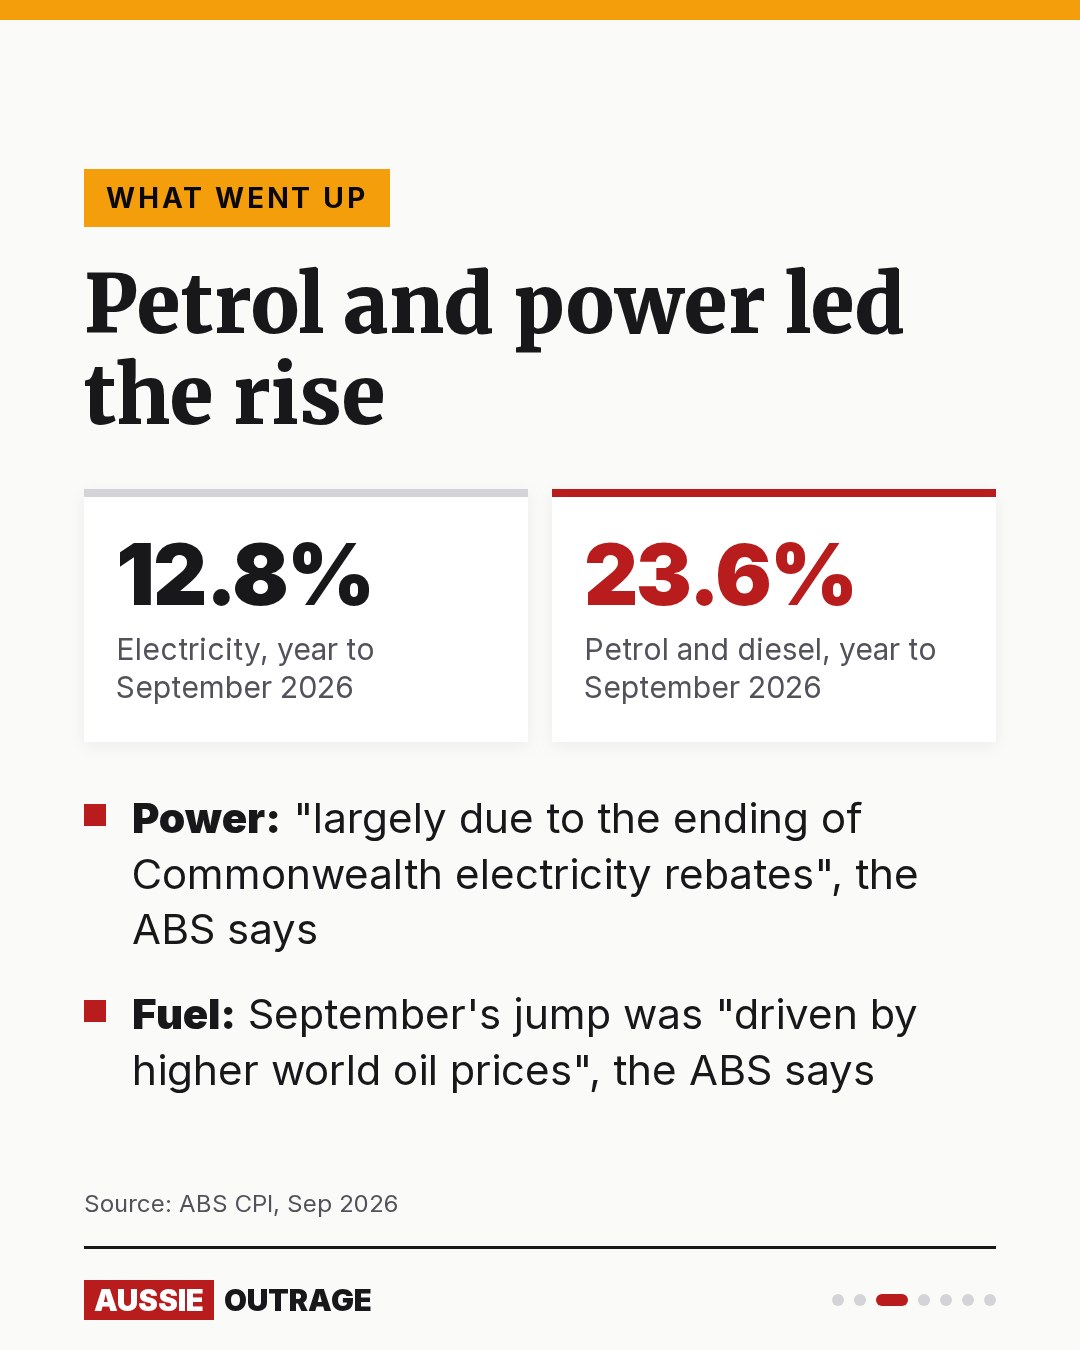
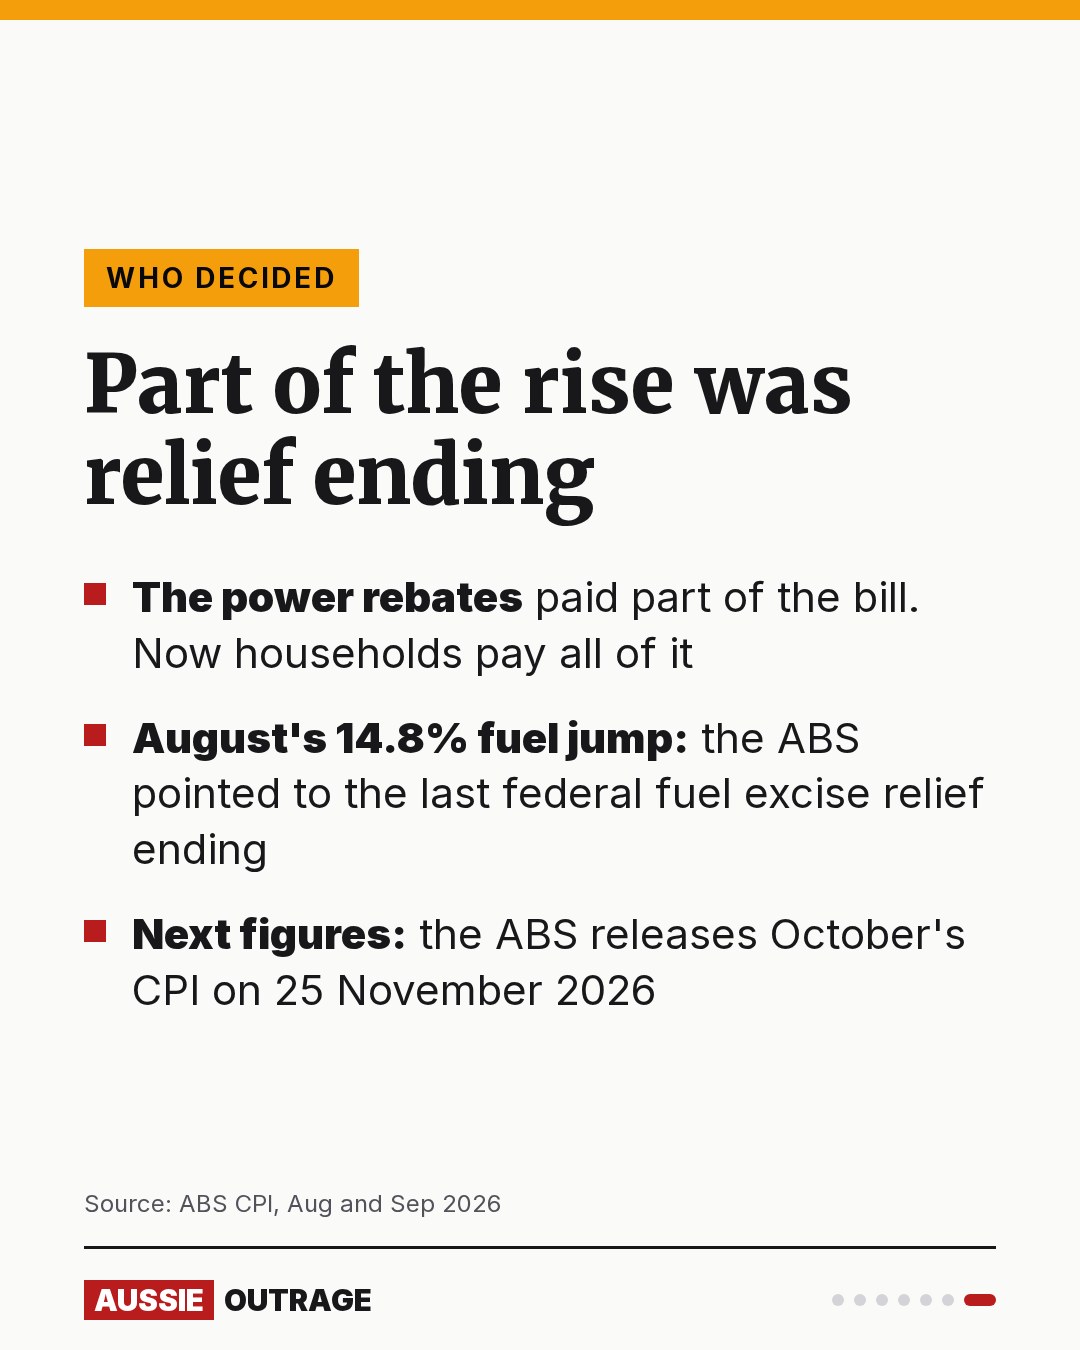
Fuel: up almost a quarter in a year. Petrol and diesel prices were up 23.6% in a year, and 9.4% in September alone, which the ABS says was "driven by higher world oil prices". That came on top of a 14.8% jump in August, when the ABS also pointed to the end of the last of the federal government's fuel excise relief.
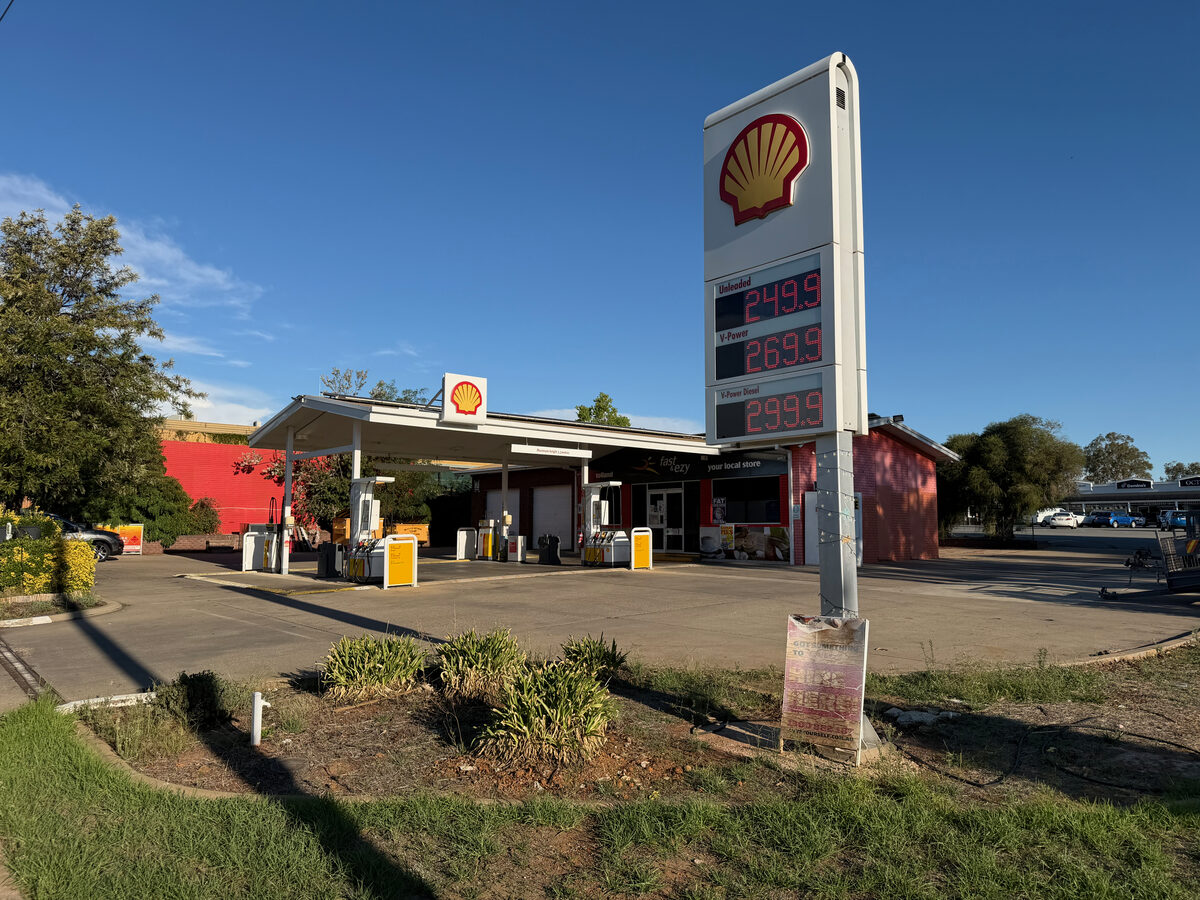
Fuel prices in Tolland, Wagga Wagga, in March 2026. Photo: Bidgee, CC BY-SA 3.0 AU, via Wikimedia Commons.
Power bills: the rebates ended. Electricity prices rose 12.8% in a year. In the ABS's words, the rise "is largely due to the ending of Commonwealth electricity rebates over the year". As we explained in why power bills are bigger even though prices "fell", the rebates paid part of the bill rather than making power cheaper. Now that they're gone, households pay all of it, and the inflation figures show it.
The other side of that: while the relief was in place, it held measured prices down. So part of this year's rise is that relief unwinding, not prices suddenly getting worse.
Council rates and insurance. Council rates and charges rose 5.6%, which the ABS says reflects higher general rates and "increases in various levies and charges, such as waste disposal levies". Insurance rose 5.4%: see why car insurance premiums are up 42%.
Housing. The cost of new homes rose 4.7%, which the ABS says was builders "raising base prices to pass through higher labour and materials costs". Rents rose 3.6%, unchanged since May.
The Reserve Bank adds a bigger picture. When it raised rates in September, it said the conflict in the Middle East had broadened and that "global energy prices are now much higher than had been assumed in the August forecasts". It also said that "AI-related demand is driving rapid growth in global prices for technology-related goods", and that "there remains pressure on domestic capacity" in Australia. Not all of the energy squeeze is global, though: Australians pay export prices for the gas left after three-quarters of east coast gas is shipped overseas.
Underlying inflation is rising too
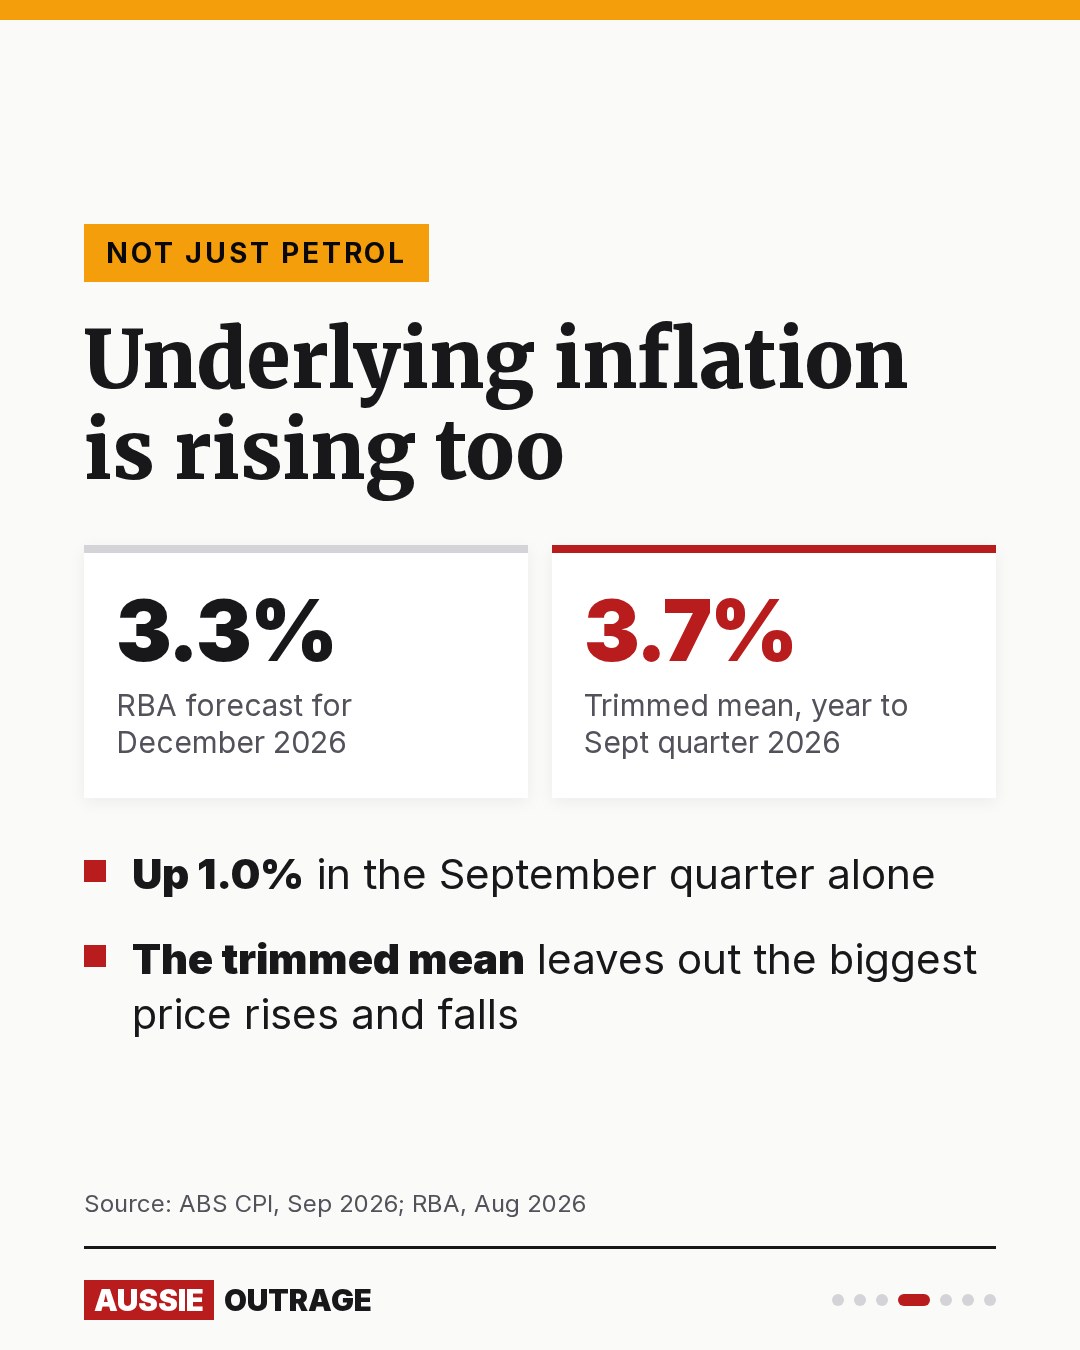
Petrol prices swing a lot, so the Reserve Bank also watches trimmed mean inflation, which leaves out the biggest price rises and falls each period. It's the Reserve Bank's preferred measure of underlying inflation, and it's going the wrong way:
- Monthly: 3.6% in the 12 months to September, up from 3.5% in August.
- Quarterly: up 1.0% in the September quarter alone, and 3.7% over the year, up from 0.8% and 3.6% in the June quarter.
In August, the Reserve Bank forecast that trimmed mean inflation would ease to 3.3% by December 2026. In the September quarter it was 3.7%, and rising.
Australia's inflation rate by year
According to the ABS's quarterly figures, inflation peaked at 7.9% in the year to the December quarter of 2022, fell to 2.1% by the June quarter of 2025, and has climbed back since.
Inflation came down, then went back up
Australia's inflation rate: rise in consumer prices over the previous 12 months, each quarter
Quarterly figures from the ABS, on its current monthly CPI basis, so some differ slightly from those first published. The ABS's monthly figure for September 2026 was 4.3%.
Source: ABS Consumer Price Index, Table 17 (quarterly)
Show the data
| Date | Value |
|---|---|
| Dec 2019 | 1.8% |
| Mar 2020 | 2.2% |
| Jun 2020 | −0.3% |
| Sep 2020 | 0.6% |
| Dec 2020 | 0.9% |
| Mar 2021 | 1.1% |
| Jun 2021 | 3.8% |
| Sep 2021 | 3.1% |
| Dec 2021 | 3.5% |
| Mar 2022 | 5.1% |
| Jun 2022 | 6.2% |
| Sep 2022 | 7.3% |
| Dec 2022 | 7.9% |
| Mar 2023 | 7% |
| Jun 2023 | 6% |
| Sep 2023 | 5.3% |
| Dec 2023 | 4.1% |
| Mar 2024 | 3.6% |
| Jun 2024 | 3.8% |
| Sep 2024 | 2.9% |
| Dec 2024 | 2.4% |
| Mar 2025 | 2.4% |
| Jun 2025 | 2.1% |
| Sep 2025 | 3.2% |
| Dec 2025 | 3.6% |
| Mar 2026 | 4.1% |
| Jun 2026 | 3.9% |
| Sep 2026 | 3.9% |
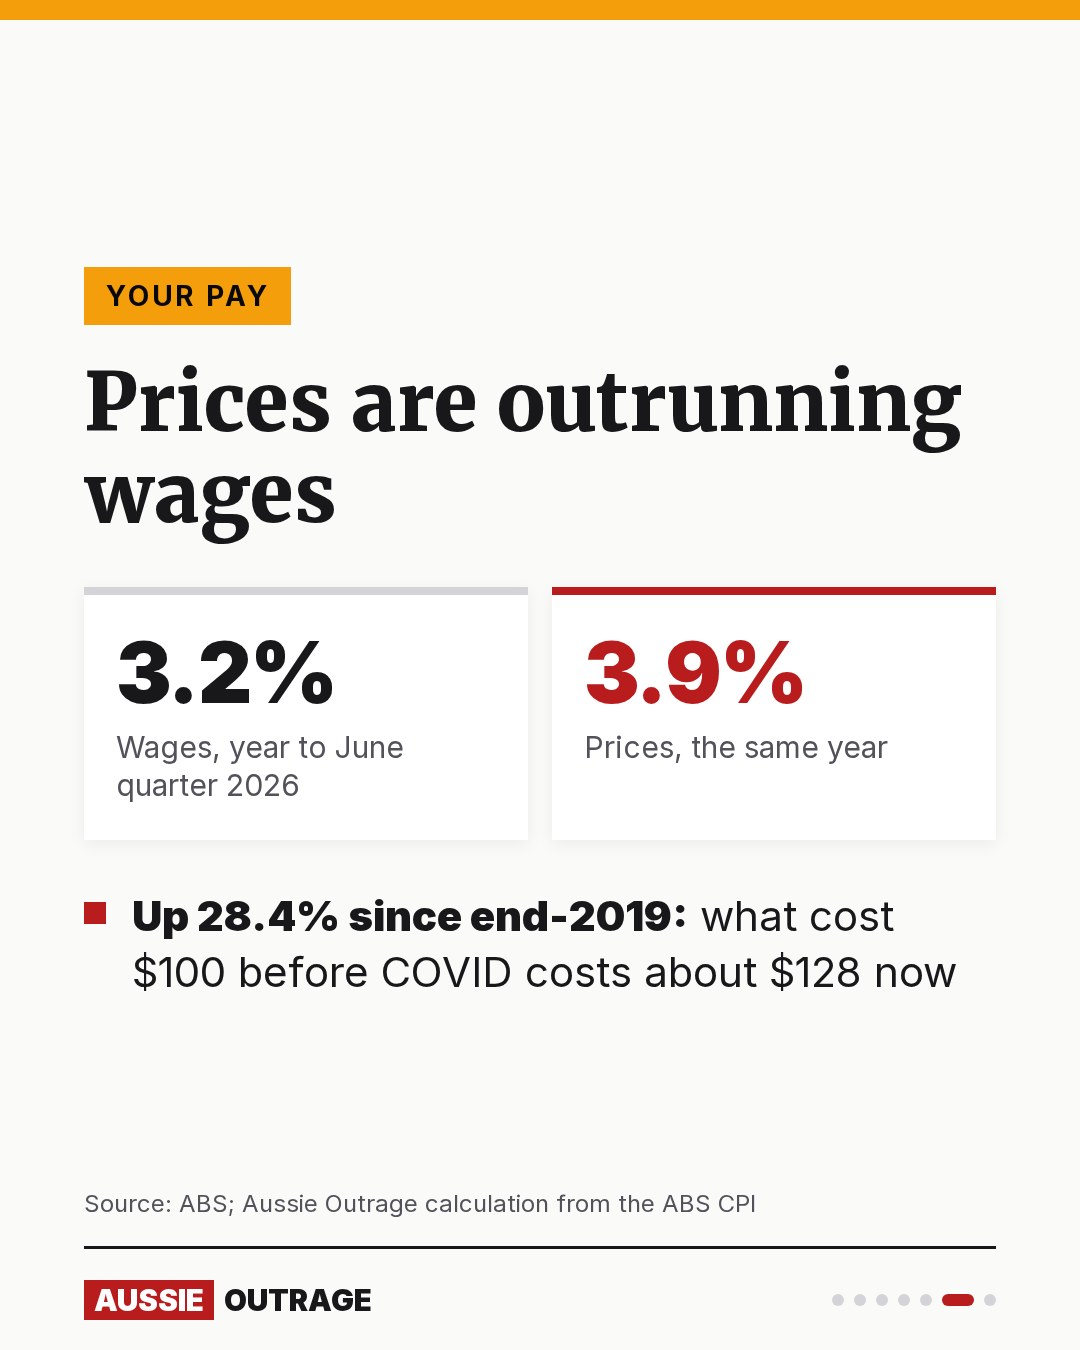
Since the end of 2019, prices have risen 28.4% in total (an Aussie Outrage calculation from the ABS consumer price index: 80.70 in the December quarter of 2019, 103.64 in the September quarter of 2026). What cost $100 before COVID costs about $128 now.
Australia's inflation compared to other countries
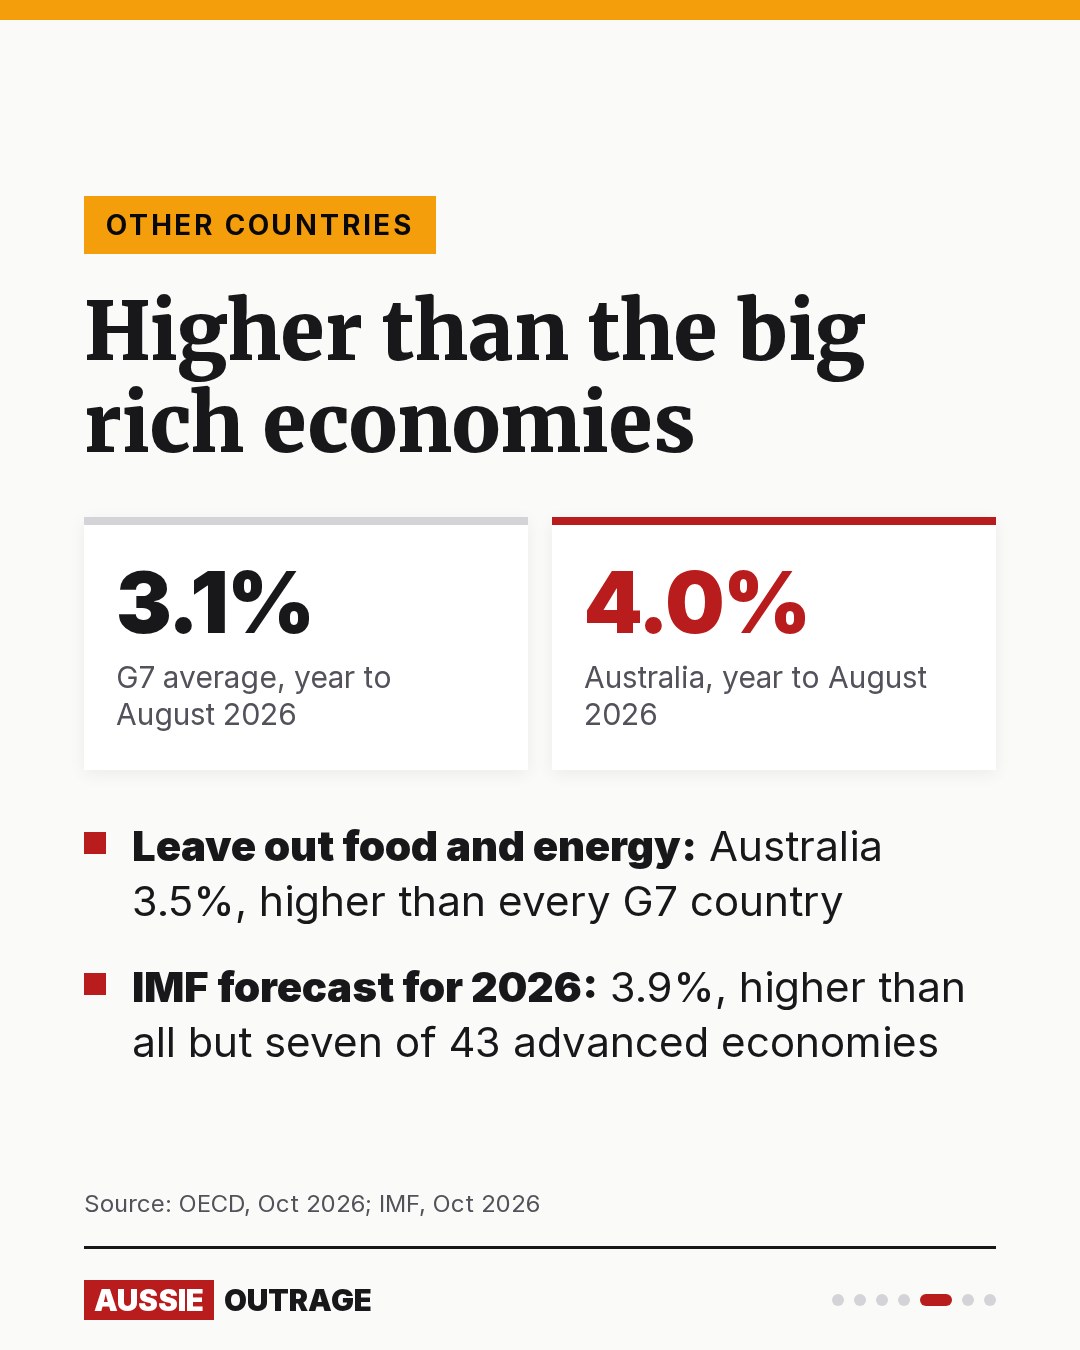
Australia's inflation is now high for a rich country. In August 2026, the latest month the OECD has compared, consumer prices in Australia rose 4.0% over the year, against 3.1% across the G7 economies and 3.2% in the euro area, according to the OECD's consumer prices release of 6 October 2026.
Australia's inflation is above the big rich economies
Rise in consumer prices over the 12 months to August 2026
New Zealand
4.1%Australia
4%United States
3.4%United Kingdom
3.3%Euro area
3.2%G7 average
3.1%Canada
3%Japan
1.9%
New Zealand's figure is for the year to the June quarter of 2026: it only measures prices quarterly. Euro area: harmonised index (HICP). Australia's September figure, from the ABS, is 4.3%.
Source: OECD, Consumer Prices, 6 October 2026 (Table 1)
Show the data
| Item | Value |
|---|---|
| New Zealand | 4.1% |
| Australia | 4% |
| United States | 3.4% |
| United Kingdom | 3.3% |
| Euro area | 3.2% |
| G7 average | 3.1% |
| Canada | 3% |
| Japan | 1.9% |
Of the 38 OECD countries, seven had higher inflation than Australia in August 2026: Türkiye, Colombia, Lithuania, Iceland, Spain, Chile and New Zealand (June quarter for New Zealand), with Belgium level at 4.0% (an Aussie Outrage calculation from the OECD's table). The OECD average of 4.3% is pulled up by Türkiye, where prices rose 31.5%.
The International Monetary Fund expects the same in its forecasts. In its World Economic Outlook of October 2026, the IMF forecasts Australia's inflation to average 3.9% in 2026, against 3.1% for advanced economies as a whole. Of the 43 economies the IMF classes as advanced, only seven are forecast higher: Iceland, Lithuania, Bulgaria, Croatia, Greece, New Zealand and Andorra. For 2027 the IMF forecasts 3.1% for Australia, still above the top of the Reserve Bank's target, and 2.7% for advanced economies.
It's not just petrol
Energy prices jumped in most rich countries in 2026, and the OECD notes Australia was one of six countries where energy inflation rose by more than 5 percentage points in August alone. Here, the ABS points to fuel excise relief and electricity rebates coming to an end. But across the G7, energy inflation was even higher, at 14.0%, according to the OECD.
What sets Australia apart is the rest of the shopping basket. Leave out food and energy, and prices in Australia rose 3.5% over the year to August 2026, according to the OECD's figures. That's higher than in every G7 country, and well above the G7's 2.3%. This fits what the Reserve Bank said in September: that "there remains pressure on domestic capacity".
| Inflation, year to August 2026 | Leaving out food and energy | Price rise since December 2019 | |
|---|---|---|---|
| Australia | 4.0% | 3.5% | 28.0% |
| New Zealand | 4.1% | 1.8% | 31.5% |
| United States | 3.4% | 2.4% | 30.4% |
| United Kingdom | 3.3% | 2.9% | 32.2% |
| Euro area | 3.2% | 2.4% | 26.7% |
| G7 | 3.1% | 2.3% | 26.9% |
| Canada | 3.0% | 1.9% | 24.5% |
| Germany | 2.9% | 2.5% | 25.3% |
| France | 2.4% | 1.2% | 19.1% |
| Japan | 1.9% | 1.7% | 13.9% |
Source: OECD, Consumer Prices, 6 October 2026, Table 1. New Zealand: June quarter 2026. Australia's "since December 2019" figure runs to the June quarter of 2026. The US figure without food and energy is an OECD estimate, and Australia's uses the ABS's own categories.
Over the whole period, Australia is in the middle
The comparison since COVID looks different. Prices in Australia rose 28.0% from December 2019 to the June quarter of 2026, according to the OECD. That's close to the G7's 26.9% and less than in New Zealand (31.5%, also to June), the United States (30.4%) or the United Kingdom (32.2%), whose figures run two months longer, to August 2026.
In 2022, the worst year, Australian prices rose 6.6% on average, against 7.3% for advanced economies, 8.0% in the United States and 9.1% in the United Kingdom, according to the IMF. The difference is now: in 2026, Australia's inflation is higher than in most of them.
Prices vs wages
Wages are rising more slowly than prices. The ABS Wage Price Index rose 3.2% over the year to the June quarter of 2026, while prices rose 3.9% over the same year. When prices rise faster than pay, the same pay packet buys less. The September quarter wage figures are due in mid-November; prices rose 3.9% over that quarter's year too.
Inflation and interest rates
High inflation is why the Reserve Bank keeps raising interest rates. It lifted the cash rate four times in 2026, to 4.60% in September, saying it "will continue to do what it considers necessary to bring inflation sustainably back to target". For people with a mortgage, that's a second hit on top of higher prices.
Higher rates reach the government too: the Reserve Bank noted in March and May that government bond yields had risen. See how much interest is paid on Australia's national debt.
When the next figures come out
The ABS publishes the consumer price index monthly, usually on the last Wednesday of the month, at 11:30am (Canberra time). The next releases are:
- 25 November 2026: October 2026
- 6 January 2027: November 2026
From February 2027, the ABS will publish on the fourth Wednesday of each month instead. We update this page when each release comes out.
Questions people ask
What is Australia's inflation rate now?
Australia's inflation rate was 4.3% in the 12 months to September 2026, up from 4.0% in the 12 months to August, according to the ABS. Trimmed mean inflation, a measure of underlying inflation that leaves out the biggest price swings, was 3.6%.
Why is Australia's inflation so high?
In 2026 the biggest rises have been petrol and diesel (up 23.6% in the year to September) and electricity (up 12.8%). The ABS says the electricity rise is largely due to the end of Commonwealth electricity rebates, and that September's fuel jump was driven by higher world oil prices. Council rates (up 5.6%) and insurance (up 5.4%) also rose faster than prices overall.
Is inflation going down in Australia?
Not yet. Inflation rose from 3.5% in July 2026 to 4.0% in August and 4.3% in September. Underlying (trimmed mean) inflation rose 1.0% in the September quarter, and was 3.7% over the year, above the 3.3% the Reserve Bank had forecast for December 2026.
What is the RBA's inflation target?
The Reserve Bank's target is to keep annual consumer price inflation between 2 and 3 per cent. The Reserve Bank sets interest rates so that inflation is expected to return to the middle of that range, 2.5%.
When did Australia's inflation peak?
Inflation peaked at 7.9% in the year to the December quarter of 2022, based on the ABS's quarterly figures. It then fell to 2.1% by the June quarter of 2025 before rising again.
Is Australia's inflation high compared to other countries?
Yes. Australia's inflation was 4.0% in the year to August 2026, against 3.1% across the G7, 3.4% in the US and 3.3% in the UK, according to the OECD. The IMF forecasts 3.9% for Australia in 2026, higher than all but seven of 43 advanced economies.
How much has inflation increased since 2020 in Australia?
Prices rose 28.4% from the December quarter of 2019 to the September quarter of 2026, an Aussie Outrage calculation from the ABS consumer price index (80.70 to 103.64). Something that cost $100 at the end of 2019 costs about $128 now.
When is Australia's inflation data released?
The ABS releases the consumer price index monthly at 11:30am Canberra time, usually on the last Wednesday of the month (the fourth Wednesday from February 2027). The October 2026 figures come out on 25 November 2026 and the November figures on 6 January 2027.
Inflation isn't the weather. Part of this year's rise came from relief ending, a decision made in Canberra, and households are now paying the full cost at the bowser and in their power bills.
Top photo: fuel prices at a service station in Brisbane, March 2026. Photo: Chris Olszewski, CC BY-SA 4.0, via Wikimedia Commons.
Sources
- ABS: Consumer Price Index, Australia, September 2026 (released 28 Oct 2026) (opens in a new tab)
- ABS: Consumer Price Index, Australia, September 2026, Table 17 (quarterly index numbers) and Appendix 1a (quarterly trimmed mean) (opens in a new tab)
- ABS: Consumer Price Index, Australia, August 2026 (released 30 Sep 2026) (opens in a new tab)
- ABS: Wage Price Index, Australia, June 2026 (released 19 Aug 2026) (opens in a new tab)
- OECD: Consumer Prices, OECD (news release, 6 October 2026, reference period August 2026) (opens in a new tab)
- IMF: World Economic Outlook, October 2026, Online Statistical Appendix, Table A6 (Advanced Economies: Consumer Prices) (opens in a new tab)
- RBA: Australia's Inflation Target (explainer) (opens in a new tab)
- RBA: Statement by the Monetary Policy Board, 29 September 2026 (opens in a new tab)
- RBA: Statement on Monetary Policy, August 2026, Outlook (Table 3.1) (opens in a new tab)
Spotted an error, or named in this story and want to respond? Tell us. We correct mistakes openly, under our editorial standards.
Got a story we should tell?
Waste you've seen up close, a policy that's hurting your family, a cost you can't keep up with. We read every tip and protect our sources.
Send us a tipMore in Cost of Living
Car insurance premiums: up 42%, and insurers don't say why
Car insurance premiums in Australia rose 42% in five years and another 8% last year. ASIC found no insurer explained why. What's driving it and how to pay less.
Aussie Outrage · · 8 min read
Coles Down Down court case: 13 of 14 discounts not genuine
The Coles Down Down court case: a judge found 13 of 14 discounts weren't genuine. No penalty until 2027, Woolworths awaits judgment, and profits are up.
Aussie Outrage · · 7 min read
Rent prices in Australia now take a record 34% of income
Rent prices in Australia: the median is $713 a week, renters pay a record 34% of income, and a full-time minimum wage worker can afford 0.5% of listings.
Aussie Outrage · · 6 min read


Interest rate rises in Australia: four in 2026, and the cost
Every RBA interest rate rise in Australia in 2026, why the Reserve Bank raised rates to 4.60%, and what they add to a typical mortgage: about $470 a month.
Aussie Outrage · · 8 min read