18-22%
How much higher the typical household power bill was in NSW, Victoria and SA, year on year, in the September 2025 quarter
Power prices 'fell' this year. So why is your bill bigger?
The regulator cut its benchmark price by a few per cent in July. But the government rebates have ended, and the rises of 2022 to 2024 haven't gone anywhere. Here's what's really happening to your power and heating bills.
Aussie Outrage · · 6 min read
In May, the Australian Energy Regulator announced good news: the benchmark electricity price for 2026-27 would fall by between 3.4% and 7.2% for households in NSW and south-east Queensland.
If you've opened a power bill since, you may not have noticed.
18-22%
The ACCC collects real bills from retailers covering nine in ten households. In the July to September quarter of 2025, the median household bill, after rebates, was 18% higher in Victoria, 20% higher in NSW and 22% higher in South Australia than a year earlier.
Three things the "price fall" leaves out
1. The rebates are gone. From July 2024, the federal Energy Bill Relief Fund took $300 off every household's power bill over the year, in $75 quarterly credits. It was extended by another $150 to December 2025, then the Treasurer confirmed it would not be extended again. The rebate never made power cheaper; it just hid part of the bill. Now the full price is back on your bill. The ABS says the end of the rebates is the main reason electricity prices rose 13.2% in the year to August 2026, one of the biggest drivers of Australia's inflation rate.
Take the rebates out and the rise is starker. Before rebates, the median quarterly bill across NSW, Victoria, South Australia and south-east Queensland was 37% higher in July to September 2025 than in the same quarter of 2021.
The real power bill, before rebates
Median household electricity bill for the July to September quarter, excluding government rebates (NSW, Vic, SA and SE Queensland)
Nominal dollars, excluding GST. Medians from retailer billing data. Bills reflect both prices and how much power households used. Same quarter each year, so winter and summer don't distort the comparison.
Source: ACCC Inquiry into the National Electricity Market, June 2026 report, Appendix C (Table A.1)
Show the data
| Date | Value |
|---|---|
| Jul to Sep 2021 | $315 |
| Jul to Sep 2022 | $324 |
| Jul to Sep 2023 | $375 |
| Jul to Sep 2024 | $391 |
| Jul to Sep 2025 | $432 |
2. A small fall after a very big rise. Look at the regulator's benchmark (the Default Market Offer) over time:
| Year | NSW | SE Queensland | South Australia |
|---|---|---|---|
| 2022-23 | Up 8.5% to 14.1% | Up 11.3% | Up 7.2% |
| 2023-24 | Up 20.8% to 23.9% across the three states | ||
| 2024-25 | Down 0.2% to 0.9% | Up 4.9% | Down 2.2% |
| 2025-26 | Up 8.5% to 9.1% | Up 3.7% | Up 3.2% |
| 2026-27 | Down 3.4% to 5.0% | Down 7.2% | Up 1.4% |
Households without a controlled load (such as an off-peak hot water meter), standing offers. Source: AER final determinations.
A 5% fall after a 20%-plus rise still leaves you far worse off than in 2022.
The last two years show it most clearly. In NSW, this year's cut doesn't undo last year's rise:
Last year's rise, this year's 'fall'
Change in the benchmark household electricity price (standing offer, households without controlled load)
NSW, 2025-26
+8.5 to 9.1%NSW, 2026-27
−3.4 to 5.0%South Australia, 2025-26
+3.2%South Australia, 2026-27
+1.4%SE Queensland, 2025-26
+3.7%SE Queensland, 2026-27
−7.2%
NSW figures are the middle of each year's range across its three network areas (2025-26: 8.5% to 9.1%; 2026-27: 3.4% to 5.0% lower).
Source: AER Default Market Offer final determinations, May 2025 and May 2026
Show the data
| Item | Value |
|---|---|
| NSW, 2025-26 | +8.5 to 9.1% |
| NSW, 2026-27 | −3.4 to 5.0% |
| South Australia, 2025-26 | +3.2% |
| South Australia, 2026-27 | +1.4% |
| SE Queensland, 2025-26 | +3.7% |
| SE Queensland, 2026-27 | −7.2% |
South-east Queensland is the exception: its cut this year is bigger than last year's rise. South Australia went up both years.
3. The benchmark isn't your bill. The Default Market Offer is a cap on the standing offer for people who never switched plans. Your bill depends on your retailer, your plan and how much power you use. The ACCC found bills rose because of both higher effective prices and higher usage.
Who's still paying the most
The regulator's 2026-27 benchmark bill for a typical household ranges from $1,899 a year in Ausgrid's network (Sydney, the Central Coast and Newcastle) to $2,604 in Essential Energy's (regional NSW), with South Australia at $2,334. Each network's "typical household" uses a different amount of power, so these aren't exact comparisons. South Australians are the only households covered by the benchmark who saw it go up again this year.
The ACCC also found households with solar panels and a battery had bills $329 to $909 a year lower (20% to 52%) than customers relying on the grid alone, a gap that leaves renters, and anyone who can't afford panels and a battery, paying the most.
And then there's heating
For millions of homes, especially in Victoria, winter means gas heating, and gas has its own story.
In Victoria, 60% of all gas is used by homes and small businesses, mostly for heating and cooking. That gas now costs around $13 to $14 a gigajoule wholesale, up from $3 to $4 before east coast exports started in 2015, because producers can sell it overseas instead. Three-quarters of east coast gas is exported.
Why it matters
Power and gas aren't optional. Families can switch brands at the supermarket; they can't switch off the fridge or the heater in July.
Next year's benchmark prices will be released in draft in March 2027 and finalised in May 2027. We'll publish what they mean for your bill the day they come out.
Tell us what your power bill was this year and five years ago: send us a tip.
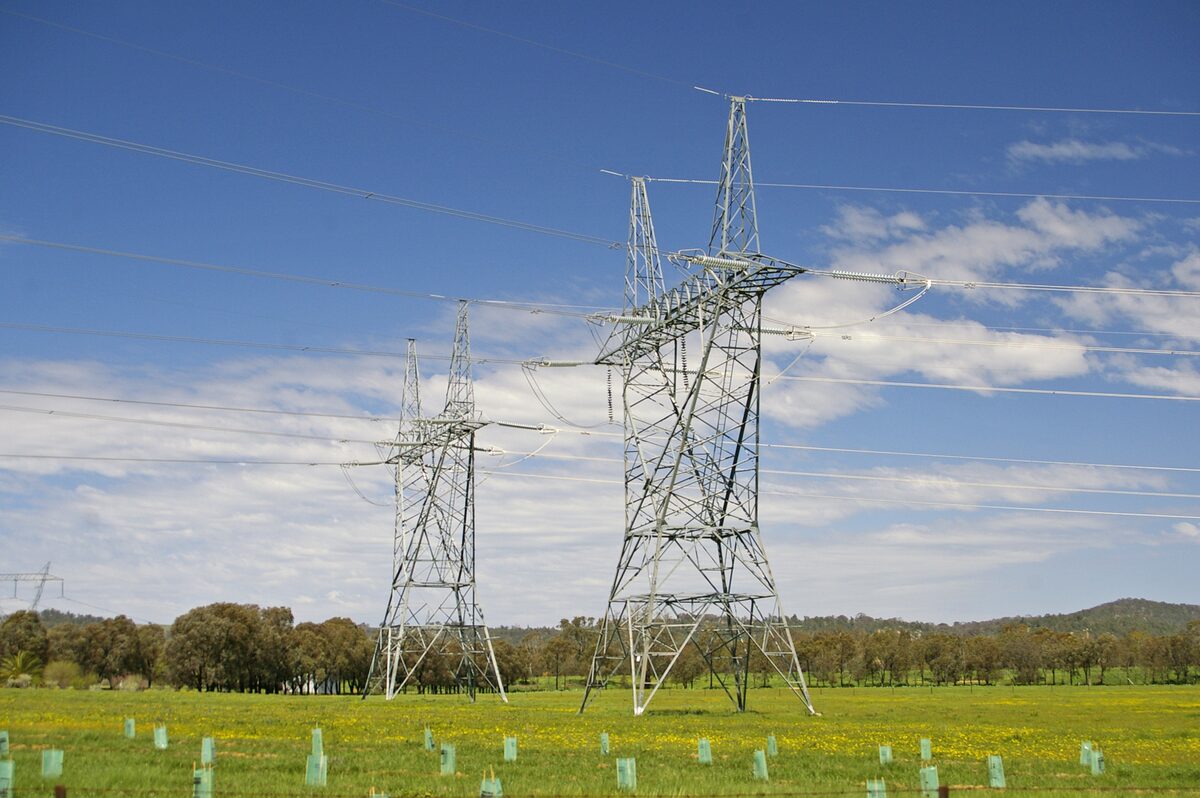
Top photo: electricity pylons at Gregadoo, NSW (file photo, 2009). Photo: Bidgee, CC BY-SA 3.0, via Wikimedia Commons.
Sources
- AER: AER releases final Default Market Offer 2026-27 (26 May 2026) (opens in a new tab)
- AER: Default market offer 2026-27 final determination (opens in a new tab)
- AER: Default market offer final determinations 2022-23, 2024-25 (revised) and 2025-26 (opens in a new tab)
- AER: Final determination for the 2023-24 default market offer (news release) (opens in a new tab)
- ACCC: Inquiry into the National Electricity Market, June 2026 report (published 10 Jul 2026) (opens in a new tab)
- ACCC: June 2026 report, Appendix C retail pricing data (Table A.1, median residential bills) (opens in a new tab)
- ACCC: Growing home battery uptake delivering lower electricity bills (10 Jul 2026) (opens in a new tab)
- SolarQuotes: It's official, Energy Bill Relief Fund rebates to end (opens in a new tab)
- Victorian Government: Energy Bill Relief Fund (opens in a new tab)
- AER: State of the energy market 2025, Chapter 4: Gas markets in eastern Australia (opens in a new tab)
Spotted an error, or named in this story and want to respond? Tell us. We correct mistakes openly, under our editorial standards.
Got a story we should tell?
Waste you've seen up close, a policy that's hurting your family, a cost you can't keep up with. We read every tip and protect our sources.
Send us a tipMore in Cost of Living
Car insurance premiums: up 42%, and insurers don't say why
Car insurance premiums in Australia rose 42% in five years and another 8% last year. ASIC found no insurer explained why. What's driving it and how to pay less.
Aussie Outrage · · 8 min read
Coles Down Down court case: 13 of 14 discounts not genuine
The Coles Down Down court case: a judge found 13 of 14 discounts weren't genuine. No penalty until 2027, Woolworths awaits judgment, and profits are up.
Aussie Outrage · · 7 min read
Rent prices in Australia now take a record 34% of income
Rent prices in Australia: the median is $713 a week, renters pay a record 34% of income, and a full-time minimum wage worker can afford 0.5% of listings.
Aussie Outrage · · 6 min read

Australia's inflation rate climbs to 4.3%. Here's why
Australia's inflation rate rose to 4.3% in September 2026, up from 4.0%. Petrol, up 23.6% in a year, and power bills after the rebates ended led the rise.
Aussie Outrage · · 13 min read